
TopoLive
Draw your network, then watch it run. Packets travel along real routes, you fail a device or a cable and see the traffic find another way, and you turn the whole diagram in 3D.
$49.99 one time
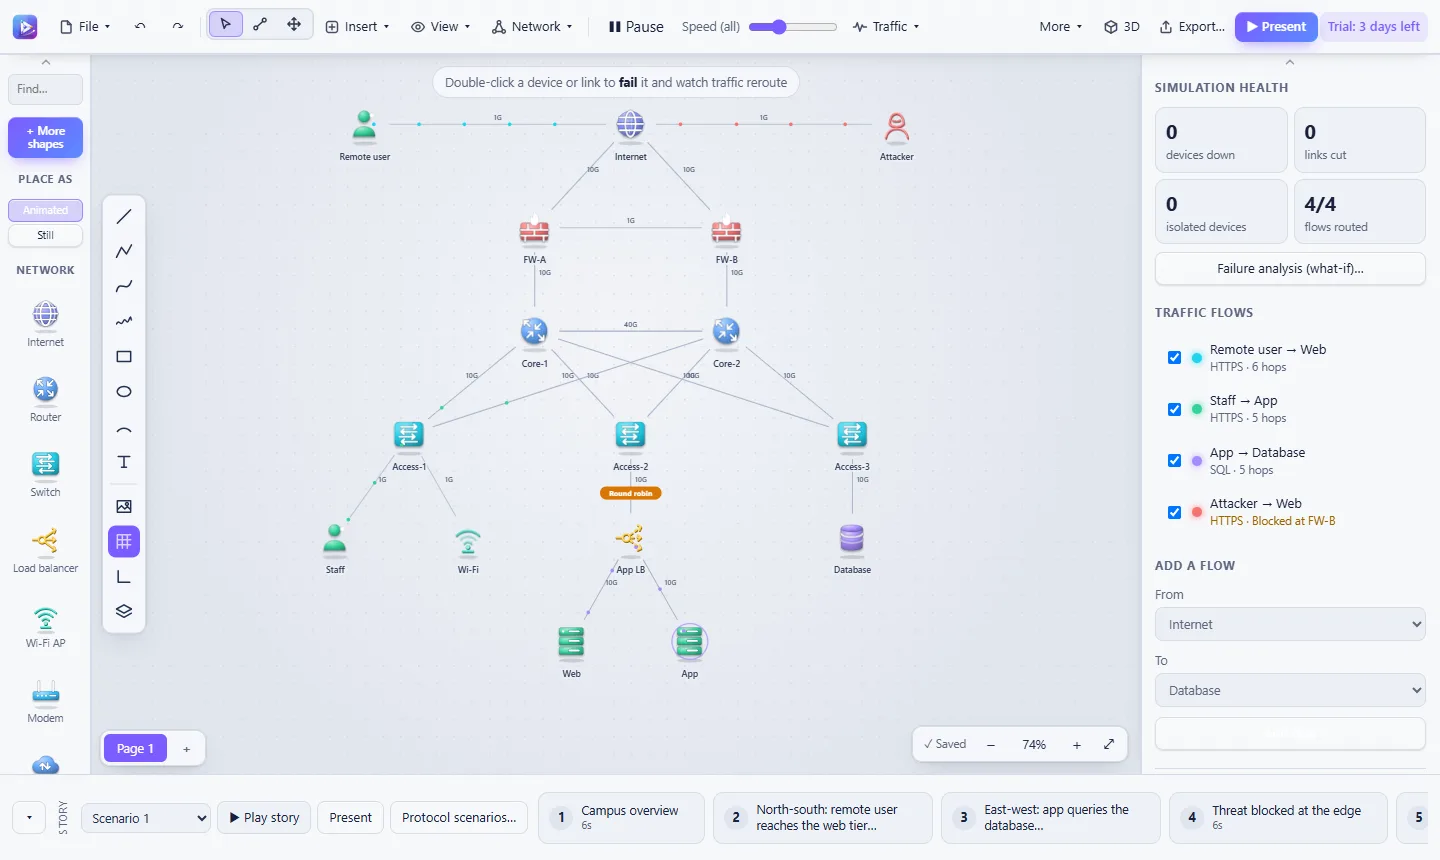
TopoLive is a diagram editor that does not stand still. Draw a network, a cloud design, a flowchart or a sequence, and then watch it work: packets travel along the routes TopoLive works out from your diagram, so you can see where traffic goes and where it stops.
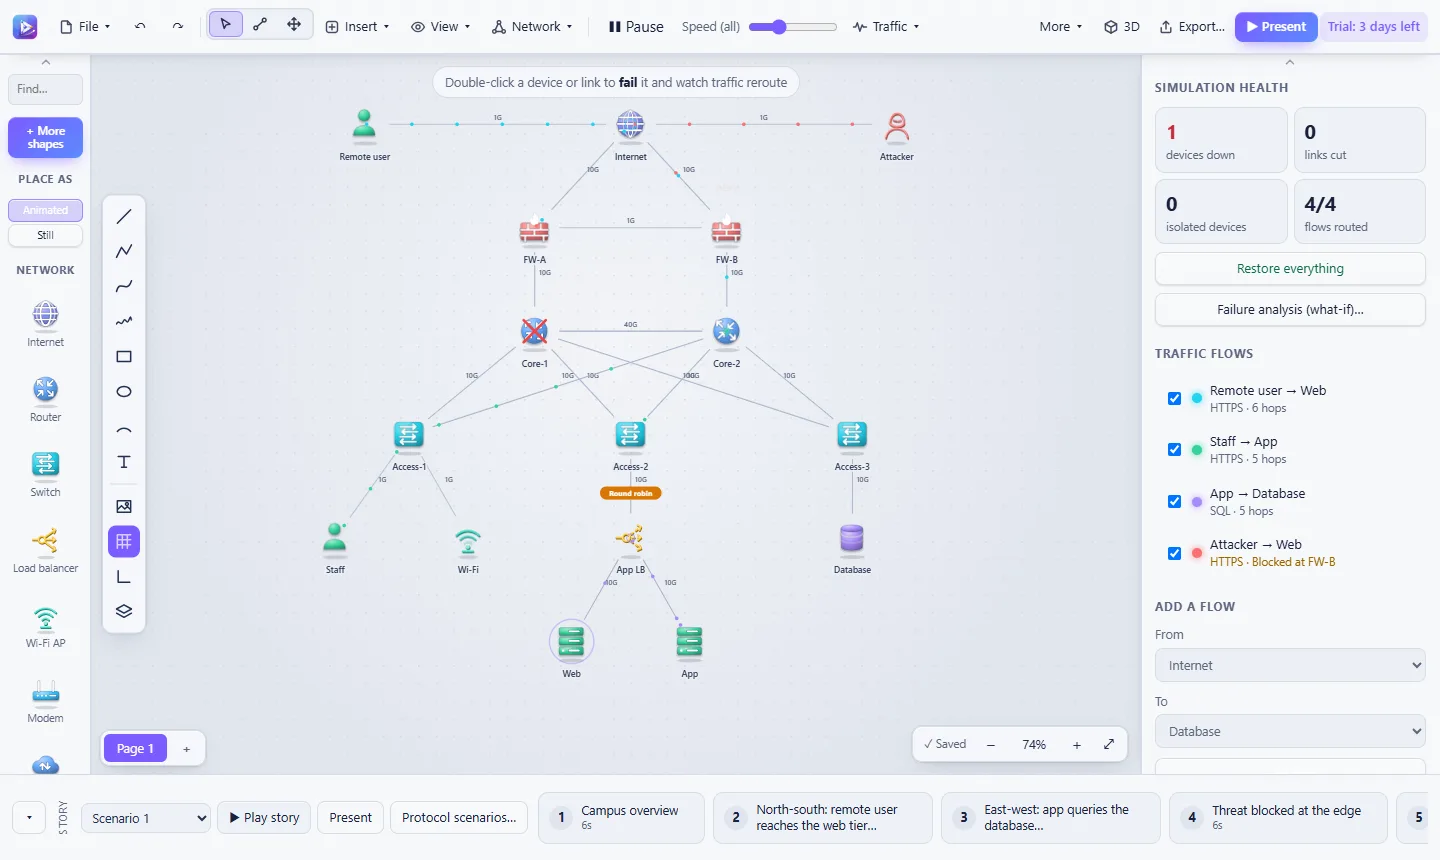
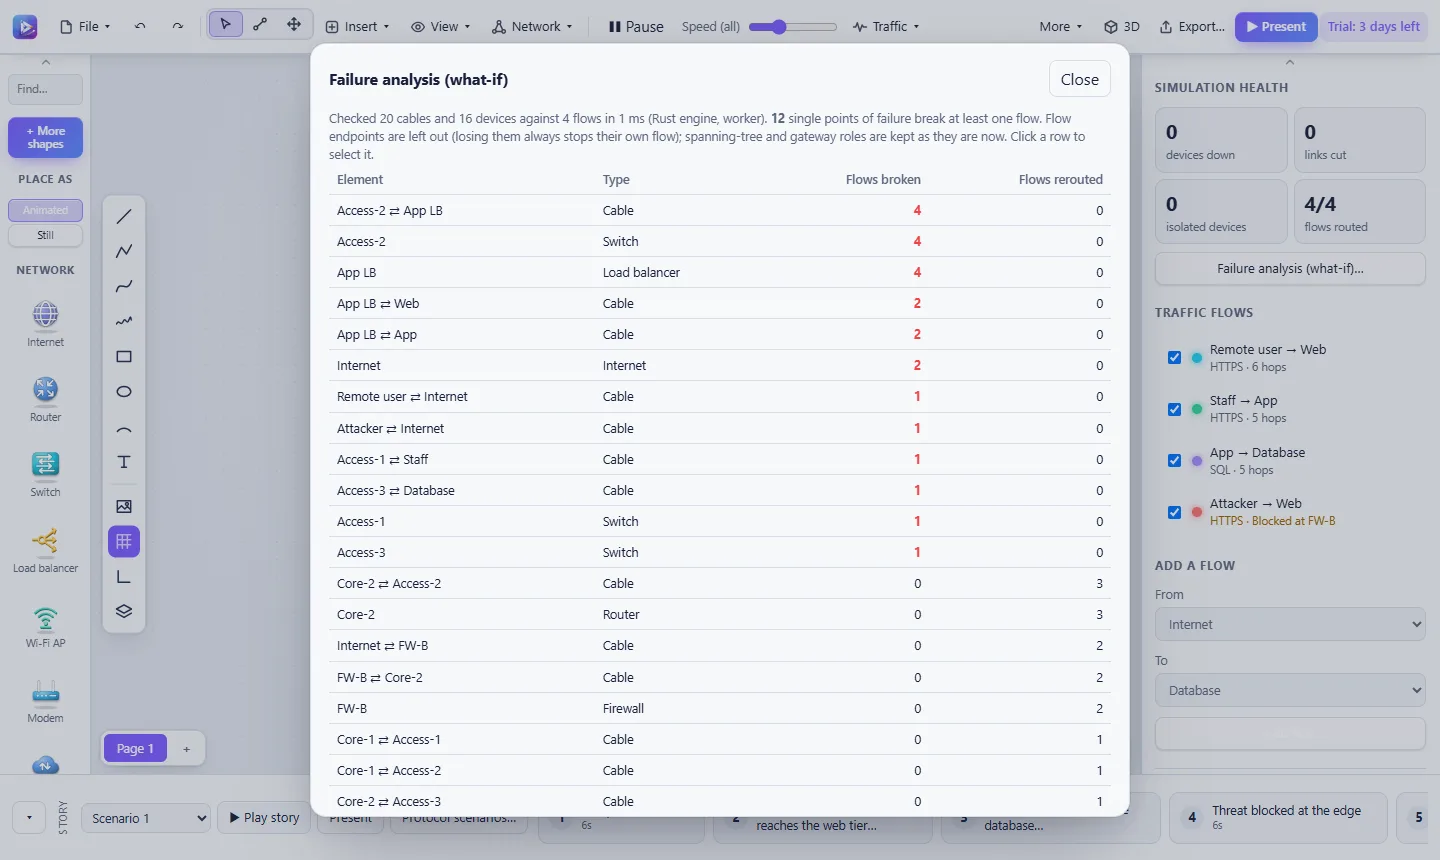
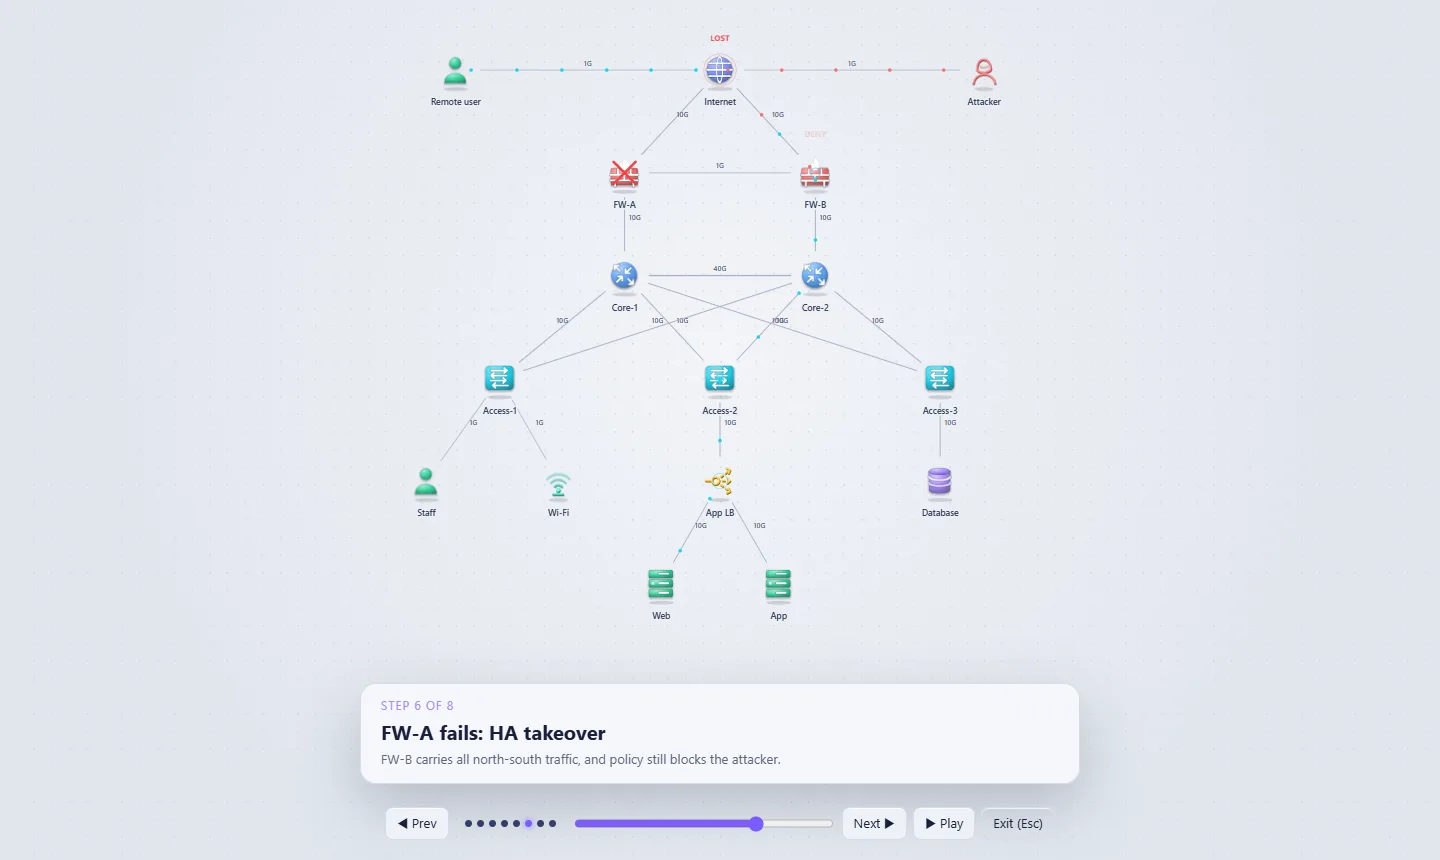
Double-click a device or a cable to fail it and traffic finds another way. A live protocol engine behaves the way the real protocols do: spanning tree elects its root and blocks ports, HSRP and VRRP hand over to the standby, OSPF and BGP choose their paths, and load balancers share the work. With realistic convergence turned on, traffic is lost for as long as the real timers would take to notice the failure. Failure analysis tries every cable and device in turn and lists the single points of failure for you.
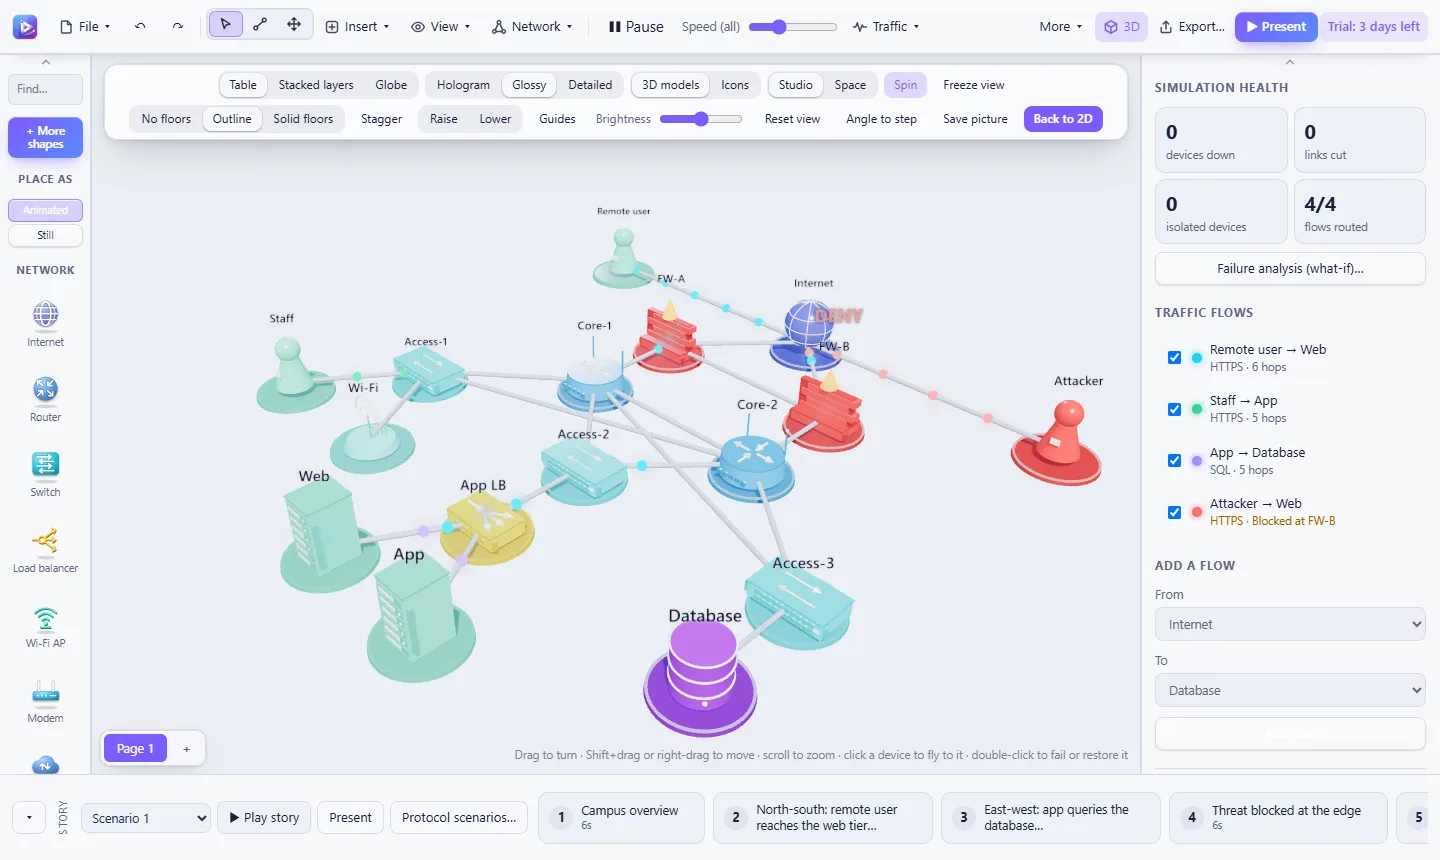
When you are ready to explain it, the story builder turns any scenario into steps, with callouts, highlights and cameras, and presents it full screen. Press 3D and turn the whole diagram in space: as a table, as stacked floors or on a globe, with traffic, failures and stories still running.
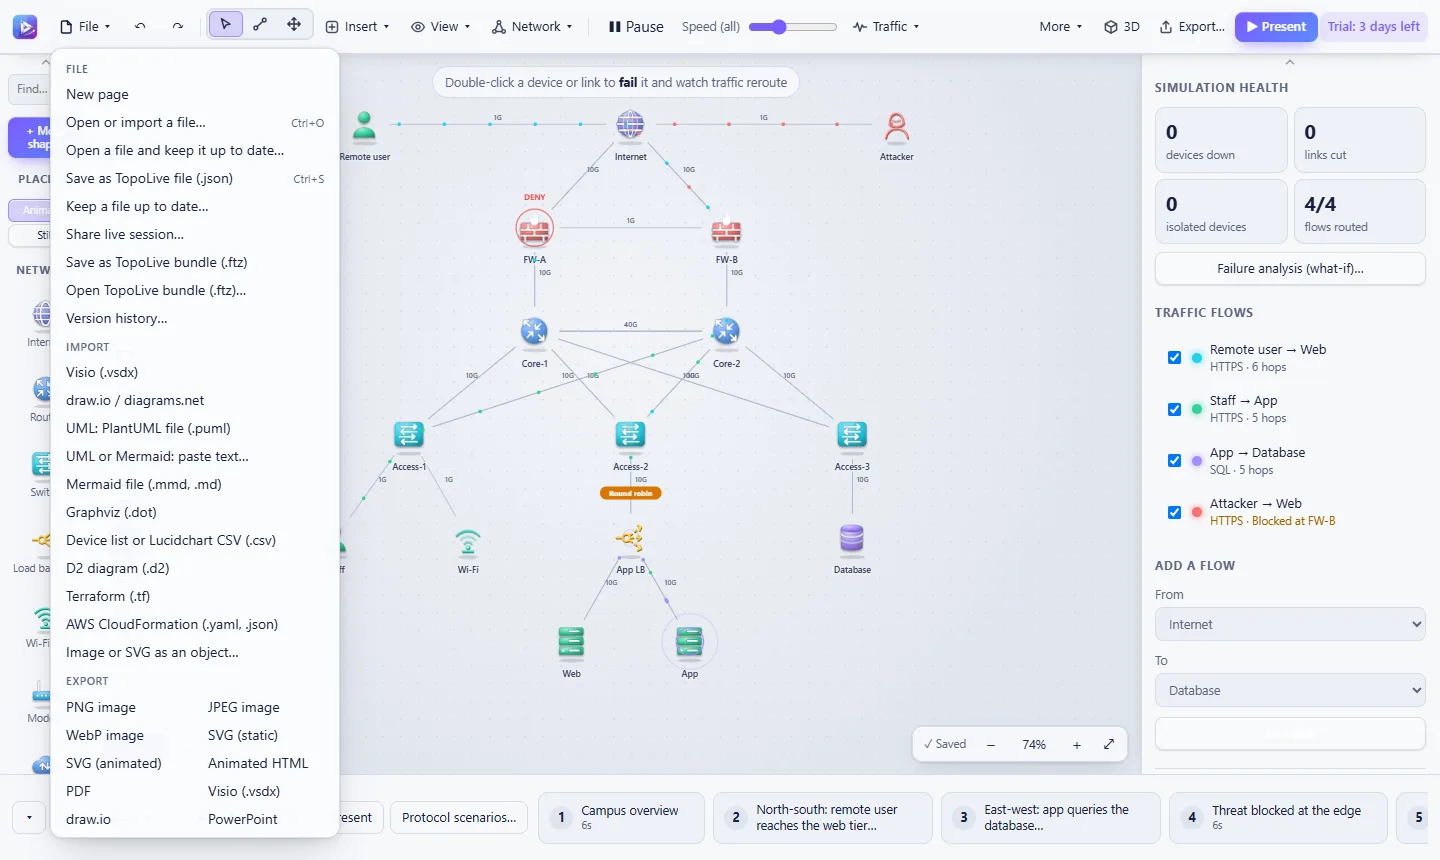
TopoLive brings in your existing diagrams (Visio, draw.io, Mermaid, PlantUML, Terraform and more) and takes them out again as PNG, PDF, SVG, Visio, PowerPoint or an animated page that plays anywhere. About 1,950 icons, all drawn for TopoLive, come in three looks.
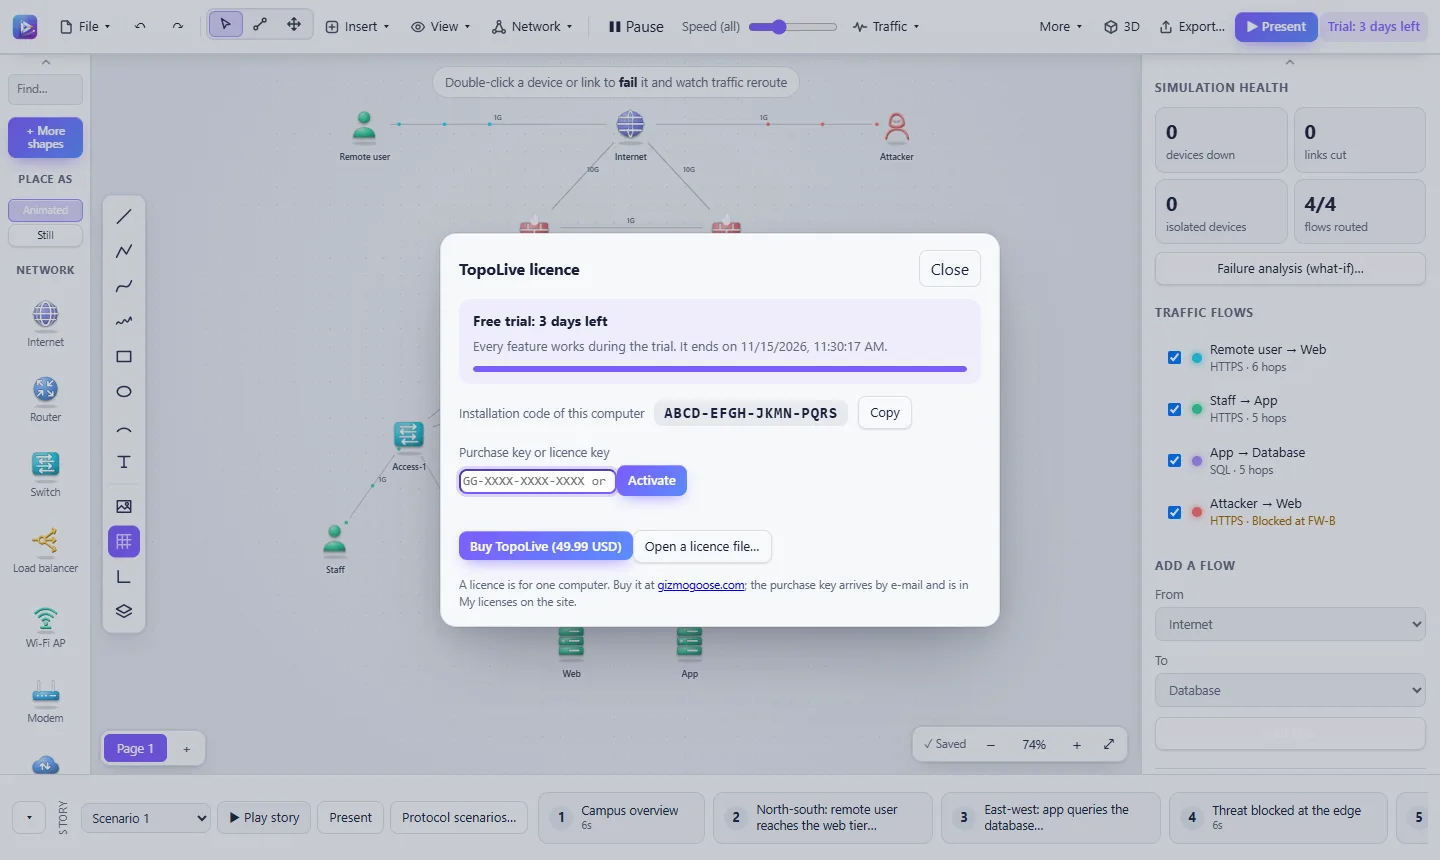
Everything runs on your own computer, in Edge or Chrome, and your diagrams stay there. Try every feature free for 3 days; one purchase key then unlocks TopoLive on your computer for good, and you can move it to a new computer yourself. The help center has step-by-step guides.
Requirements: Windows with Microsoft Edge or Google Chrome. TopoLive installs for your own user account, with no administrator rights; a small local server starts quietly in the background, and TopoLive opens in your browser. Keeping a file up to date needs Edge or Chrome.
TopoLive in pictures
What it does
- Packets that really travel: routes are worked out from your diagram, and every cable has its own packet shape, colour and speed
- Fail a device or a cable with a double-click and watch the traffic reroute, with a list of every single point of failure
- A live protocol engine for spanning tree, HSRP and VRRP, OSPF, BGP and load balancers, with realistic convergence timers and thousands of ready-made scenarios
- Story builder and full-screen presenting: step by step, with callouts, highlights and cameras
- Interactive explainers from any diagram: step tabs at the side, callouts, pictures and effects, shared as one small offline page (also in 3D), a step PDF, a video, a GIF or a SCORM package
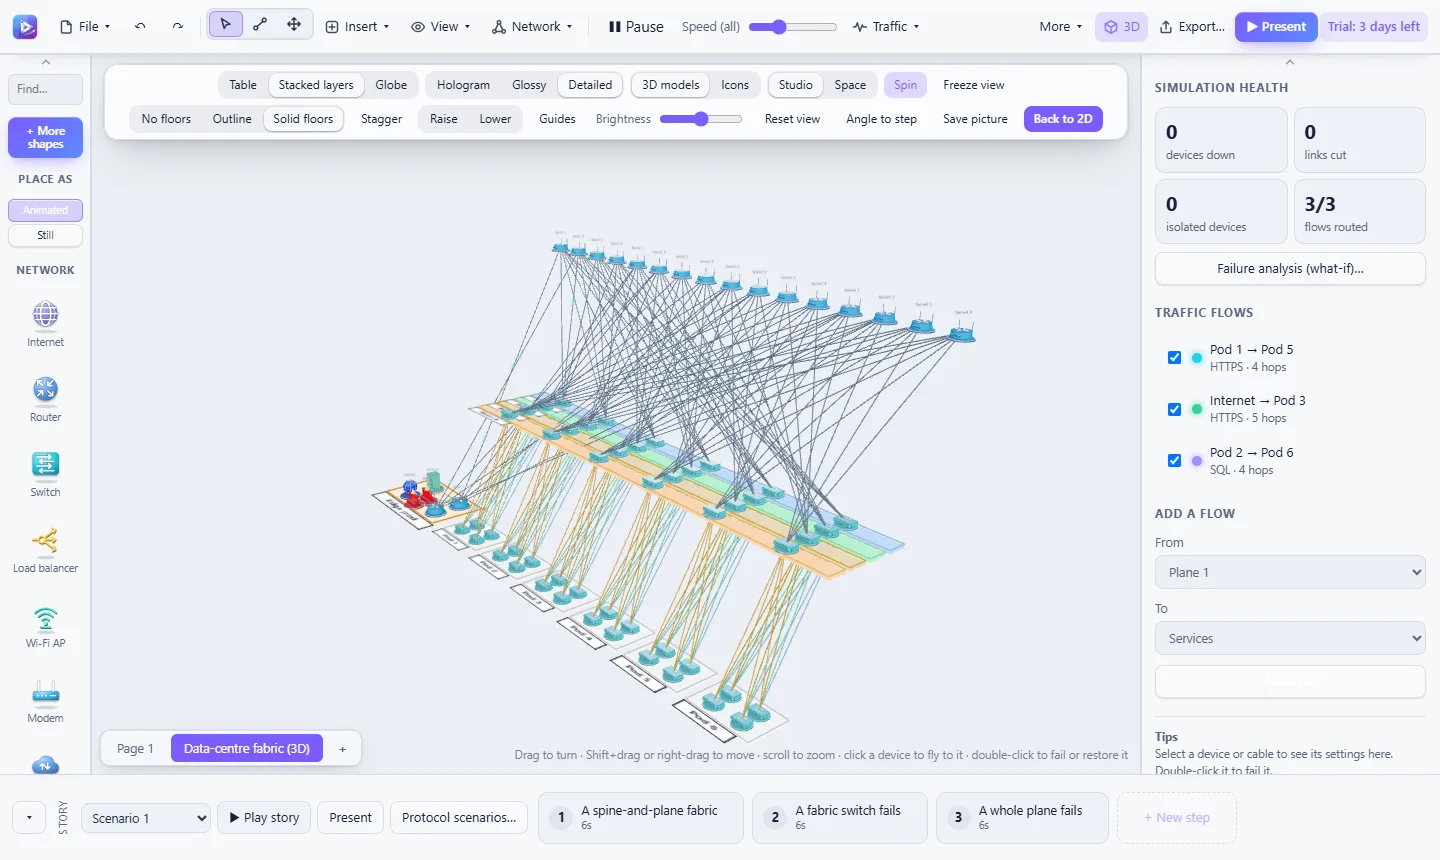
- Turn the whole diagram in 3D: tables, stacked layers or a globe, coloured floors and a data-centre fabric template
Show all 9
- About 1,950 original icons in three looks, and import from Visio, draw.io, Mermaid, PlantUML and Terraform
- Export to PNG, PDF, SVG, Visio, PowerPoint or an animated HTML page that plays your stories
- Runs entirely on your computer, in Edge or Chrome, in English, Arabic, German, Chinese and Russian
Every feature
Traffic that moves
4
- Packet flows between any two devices, routed along the shortest path by link cost or bandwidth
- Seven packet shapes: dots, comets, dashes, arrows, data packets, pulses or just the link stream
- Every cable has its own direction, packet shape, colour, speed and packets per second; a Lines slider sets how thick every link and packet looks
Show 1 more
- Firewalls block the traffic they should, and a failed device can cut off a whole part of the network so you see its blast radius
Fail it and watch
3
- Double-click a device or a cable to fail it: traffic reroutes by itself, and a flow that cannot get through shows where it stopped
- Failure analysis (what-if) fails every cable and device in turn and lists the single points of failure, with the flows broken and rerouted for each
- Choose Simulate on any device or link to play a protocol action on it at once
A live protocol engine
4
- Works out behaviour from each device's own settings: spanning tree root and blocked ports, HSRP, VRRP and GLBP active and standby with preemption, OSPF costs, ECMP, BGP best exit and load-balancer pools with health checks
- Realistic convergence: after a failure, traffic is lost until BFD or the routing protocol's own dead or hold timer notices, then it converges, with the timers following your speed slider
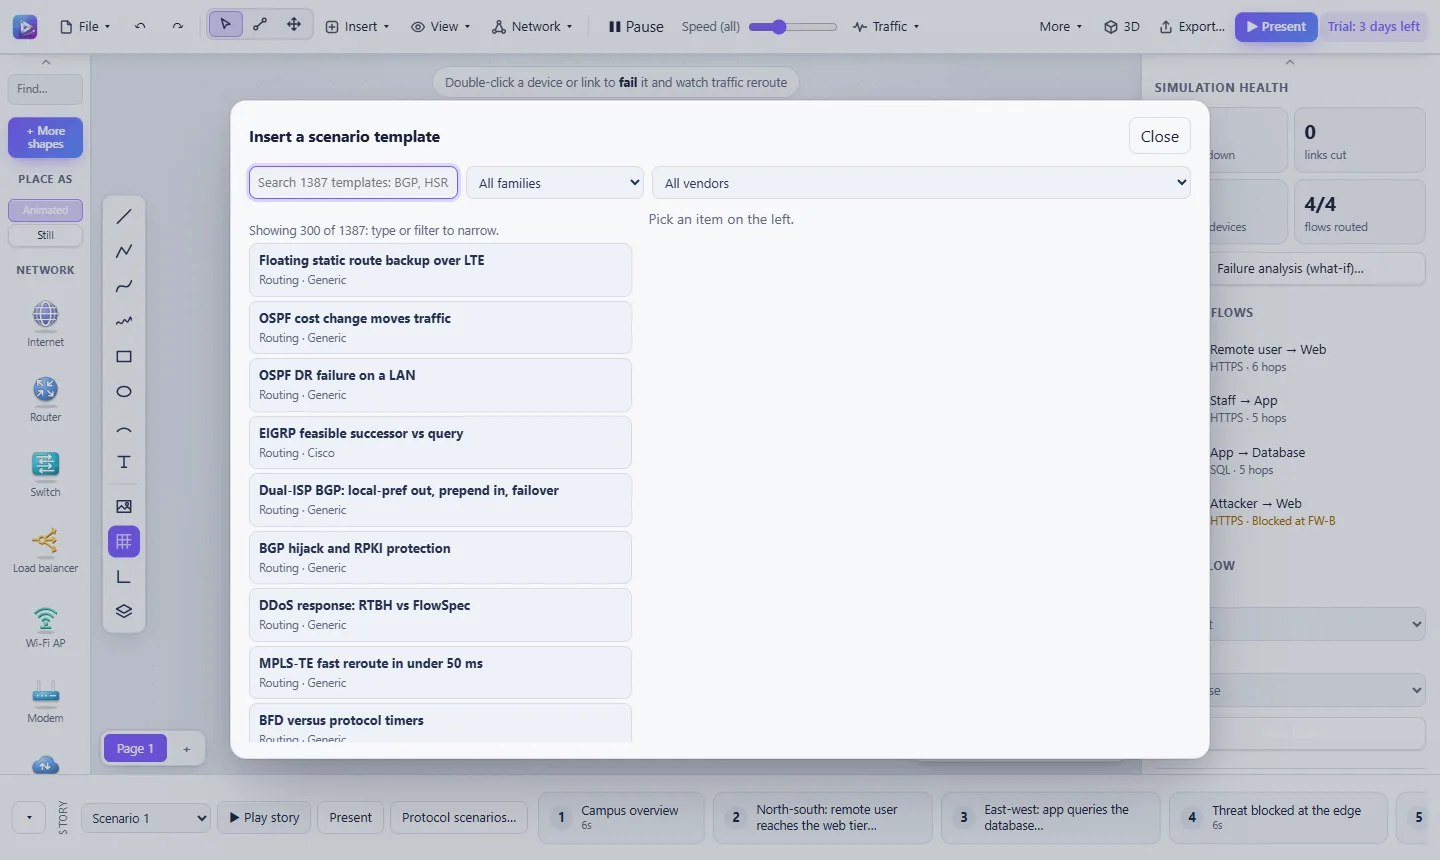
- A catalogue of 6,674 actions, 1,387 ready-made scenario templates and 124 vendor platforms: routing, switching, VPNs and overlays, security and incident response, load balancing, data centres, cloud, Kubernetes, 5G and more
Show 1 more
- Templates fit onto your own devices, so a scenario plays on your diagram
Stories and presenting
4
- Several stories per page; each step remembers its failures, running flows, hidden items, highlights, labels, badges, colours, callouts, dimming, camera and time
- Play the whole story with its timing, or step through it by hand
- Present full screen (F5), or show a clean full-screen view of the diagram (F11)
Show 1 more
- Export the story to PowerPoint, one slide per step, or to an animated HTML page that plays on any computer
Interactive explainers
5
- Lanes for tiers, cards with a protocol line and a metrics line, and chip labels on the links
- A Card tab on every device and shape: chips, facts, notes and links that viewers open with a click
- In Present mode: step tabs with an Overview, a route line above each step, a details panel and a legend, all usable from the keyboard
Show 2 more
- Export as one small Explainer page that works offline and makes no network requests, with or without a 3D view
- Or as a step-by-step PDF with every part's details, a walkthrough video or GIF, a SCORM package for learning systems, or embed code
The 3D view
8
- The same page as a 3D scene you turn with the mouse, with traffic, failures and stories still running
- Table (as drawn), Stacked layers (rows or zones become floors) or Globe
- Hologram, Glossy or Detailed looks; devices as 3D models or as their icons; a studio backdrop or space
Show 5 more
- The Panels look for flowcharts, UML and other shape diagrams: glass panels with the text inside in dark space, in five themes
- Zones become thin outlines or solid coloured floors with name signs; raise or lower any device or zone by half floors
- The Data-centre fabric (3D) template: spines, four planes, six pods and an edge pod
- Big pages stay smooth: 500 devices at 60 frames a second and 1,000 at 30 on ordinary integrated graphics
- A story step can remember its 3D angle, and Save picture exports it as a PNG
Draw and design
4
- About 1,950 original icons in over 120 categories, each with a still and a self-animating twin, in three looks: Soft 3D, Neon and Line
- Flowchart, UML, BPMN and entity-relationship shapes, plus line, curve, freehand and text tools with snapping, rulers and layers
- Properties on every device: vendor, model, serial, software version, management IP, ports, location, owner, cost and custom fields, shown on the diagram if you tick them
Show 1 more
- Six themes, multi-page documents, an unlimited canvas or real paper sizes, and a guided tour for the first time
Bring files in and take them out
4
- Import Visio, draw.io, Mermaid, PlantUML, Graphviz, CSV device lists, Lucidchart CSV, D2, Terraform and AWS CloudFormation
- Recognised devices from a Visio file become live TopoLive devices, and flows are suggested
- Export PNG, JPEG, WebP, PDF with selectable text, SVG (animated or still), Visio, draw.io, PowerPoint, Mermaid, PlantUML, Graphviz, an inventory CSV and TopoLive JSON
Show 1 more
- Print with page sizes, margins and page titles
Keep your work safe
3
- Keep a file up to date (Edge and Chrome): pick a file once and every change is also written to it, ready to back up or move to another computer
- Autosave, a version history of the last 10 snapshots, and bundles that hold the diagram with its pictures
- Live sessions: edit one diagram together in real time, with each other's cursors
Private and yours
5
- Runs entirely on your computer: your diagrams stay on it, with no account and no cloud
- It goes online only for licence activation and check-in, and for a live session you start
- English, Arabic (right to left), German, Chinese and Russian
Show 2 more
- A 3-day free trial with every feature, then pay once, no subscription
- One computer at a time, and you move the licence to a new computer yourself